Grafana: How to export graphs as images and email them
Grafana is one of the most used dashboarding and alerting tools, it has many features but recently i noticed that lacked the capability to…

Grafana is one of the most used dashboarding and alerting tools, it has many features but recently i noticed that lacked the capability to send graphs as emails in a scheduled manner.
Fortunately enough Grafana allows exporting graphs as PNG images using its API, But first you need to create an API key, to get one go to
- Configuration > API keys
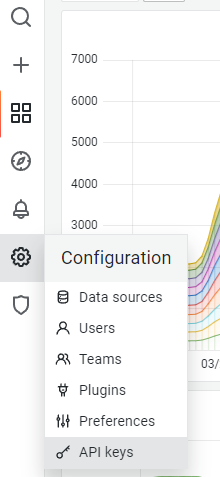
Then click the “Add API Key” button

Enter a name for the key, a long time to live value and as role select “Admin”, Then you should see something like this confirming that you created the key
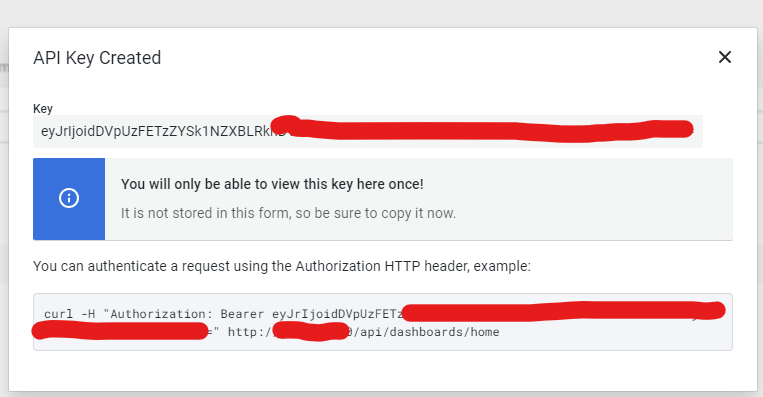
The generic syntax to authenticate vs a Grafana server is the followingcurl -H <key> http://<grafana_server>/<url>
Now that we have the authorization key the next step is to go to a graph that we want to have it in a scheduled fashion and go to its “share” menu
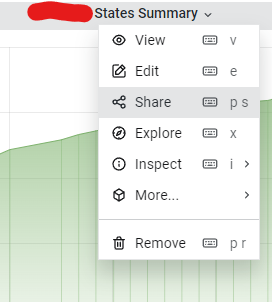
The following menu will open, from there click on the “Direct link rendered image”
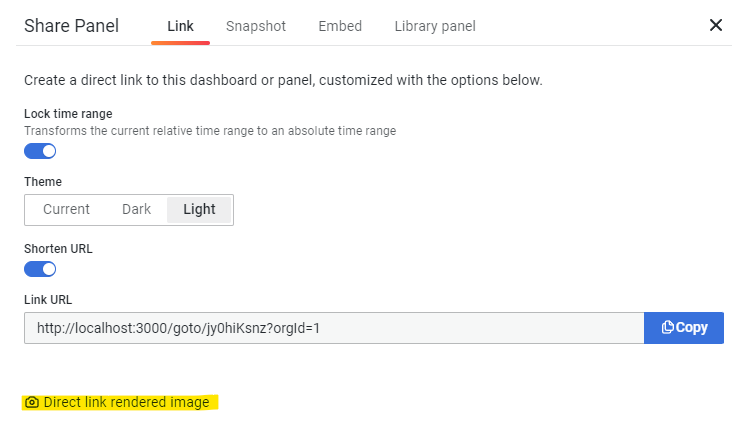
A new browser tab will open with the graph as a PNG image, the url of this tab will be used to automatically generate exports of our graphhttp://<grafana_server>/render/d-solo/uzieuOY7z/servers-statistics?orgId=1&from=1648451215600&to=1648472815600&panelId=5&width=1000&height=500&tz=Europe%2FAthens
From this url the important parameters are
- from: a value in epoch milliseconds that define the start of the graph
- to: a value in epoch milliseconds that define the end of the graph
Now we need to glue some bash scripting magic and all the Grafana things we did so far, create a file grafana_export.sh and enter the following.
Of course you need to adjust the following to your environment / needs
- START_REPORT_DATE: The start time for the graph
- END_REPORT_DATE: The end time for the graph
- url: The Grafana url
- out: The filename to write the graph
- -H: The Authentication token#!/bin/bash
START_REPORT_DATE=`date +"%Y-%m-%d 07:00:00"`
END_REPORT_DATE=`date +"%Y-%m-%d 10:10:00"`
START_REPORT_DATE_EPOCH=$(date -d "$START_REPORT_DATE" +'%s%3N')
END_REPORT_DATE_EPOCH=$(date -d "$END_REPORT_DATE" +'%s%3N')url="http://<grafana_server>/render/d-solo/uzieuOY7z/servers-statistics?orgId=1&from=$START_REPORT_DATE_EPOCH&to=$END_REPORT_DATE_EPOCH&panelId=5&width=1000&height=500&tz=Europe%2FAthens&theme=light"
out="VLTS_G2S_OPEN_$START_REPORT_DATE $END_REPORT_DATE.png"
out=`echo $out | tr -s "\ " "\_" | tr -d ":"`out=`echo $out | tr -s "\ " "\_" | tr -d ":"`
curl -o $out -H "Authorization: Bearer eyJrIjoiOEJGJGJG" $url 2>/dev/null
The script works in a very simple manner
- START_REPORT_DATE and END_REPORT_DATE get the current date and we append the fixed hours of 07:00:00 for start time and 10:10:00 for end time.
- The START_REPORT_DATE_EPOCH and END_REPORT_DATE_EPOCH variables have the same timestamps in an epoch milliseconds format that Grafana understands.
- the url replaces the from and to values with the previous generated values
- the out variable holds the filename that we want to save the graph
- curl does the request to Grafana server and saves the graph
Next step is to send the graph attached in an email, for such jobs i prefer tha mailx toolecho "The email body $(date)" | mailx -r <from> -s "A subject $(date)" -a $out <to> && sleep 10
- echo : Writes the body of the email along with the current timestamp
- mailx: The tool
- -r : who sends the email
- -s: A subject for the email and a timestamp
- -a $out : -a is an option to add an attachment, $out holds the graph we generated
- <to> : recipients list
- && sleep 10 : Well this is not mandatory, but in my case was needed because mailx exited without having time to sent the email with the attachment
I hope you found this article useful and make your life easier :)
