How to Generate Weekly Sinusoidal Data with Random Noise Using Pandas
Time series data is used in many-real world scenarios like sales trends, stock prices, and weather patterns. Many of these phenomena…

Time series data is used in many-real world scenarios like sales trends, stock prices, and weather patterns. Many of these phenomena exhibit cyclical behavior, such as weekly, monthly, or yearly trends. In this article, we will focus on weekly sinusoidal patterns and introduce random noise to simulate a more realistic dataset and then we will plot the dataset.
Generate a Time Series with a weekly sinusoidal pattern
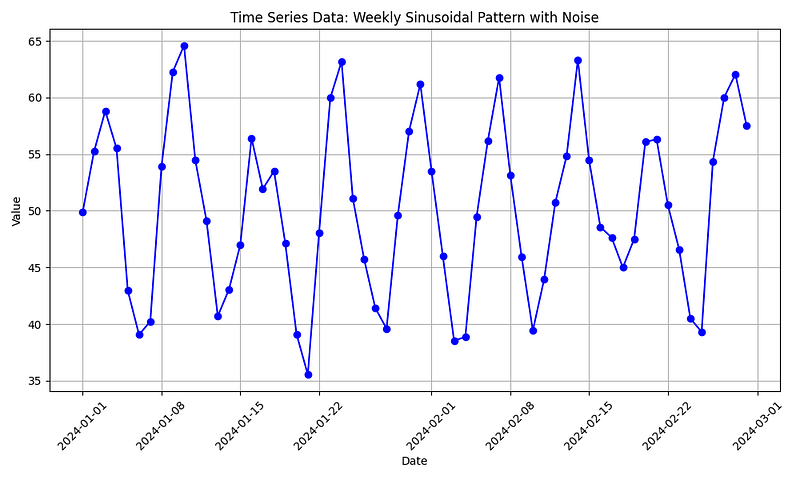
We will simulate a time series with 60 days of data where values follow a weekly repeating sinusoidal trend. Each week’s data will oscillate between a high and a low value, and we will add some random noise to make it more realistic.
#!/usr/bin/env python3
import pandas as pd
import numpy as np
import matplotlib.pyplot as plt

# Generate a time series of data for 60 days
dates = pd.date_range(start='2024-01-01', periods=60, freq='D')

# Create random values with a weekly sinusoidal pattern + noise
values = [50 + np.sin(i / 7 * 2 * np.pi) * 10 + \
          np.random.normal(0, 3) for i in range(60)]

# Create a DataFrame to simulate the time series data
df = pd.DataFrame({'date': dates, 'value': values})

# Plot the data to visualize the sinusoidal pattern
plt.figure(figsize=(10, 6))
plt.plot(df['date'], df['value'], marker='o', linestyle='-', color='b')
plt.title('Time Series Data: Weekly Sinusoidal Pattern with Noise')
plt.xlabel('Date')
plt.ylabel('Value')
plt.grid(True)
plt.xticks(rotation=45)
plt.tight_layout()
plt.show()
Explanation:
- We use the since function to generate values that oscillate in a wave pattern. The amplitude (size of the wave) is controlled by
* 10, meaning the values will vary by +/- 10. - Random noise is added with
np.random.normal(0, 3)to simulate real-world variability. This will add small deviations to each value. - sinusoidal function:
i/7here i represents the current day (or time step), and dividing it by7scales the sine wave to complete one full cycle every 7 units. This makes the wave to repeat every 7 days (sincei/7makes the sine function return to the same value every 7 days). - Vertical Shift:
50 + ...this shifts the entire wave upwards by 60 units. Without this, the sine wave could oscilate around0(between-10and10). By adding50, the sine wave now oscillates around50, with values fluctuating between 40 and 60.
Executing the code produces the following plot.
Conclusion
In this article, we explored how to generate random weekly sinusoidal data using Pandas and NumPy. By leveraging the sine function, we created a fluctuating dataset that mimics real-world cyclical patterns, such as sales or temperature variations, with a defined weekly rhythm. The addition of random noise further enhanced the realism of the dataset, making it more suitable for analysis and modeling. This approach allows researchers and data analysts to simulate and study seasonal behaviors, enabling better insights into time-dependent phenomena. Whether for predictive modeling, data visualization, or statistical analysis, the ability to generate synthetic time series data is a valuable skill in the data science toolkit.