Linux: How to real-time plot in a terminal
Often i need a quick visualization of data generated in real time by a command line tool, looking for such tools i found ttyplot which is…

Often i need a quick visualization of data generated in real time by a command line tool, looking for such tools i found ttyplot which is very cool and easy to lean.
Where i download ttyplot?
There is a github repository for this tool, it has some time to be updated.
You can install it directly using curlcurl -LO https://github.com/tenox7/ttyplot/releases/download/1.4/ttyplot_1.4-1.deb && sudo apt install ./ttyplot_1.4-1.deb
Examples
Plot values from a file
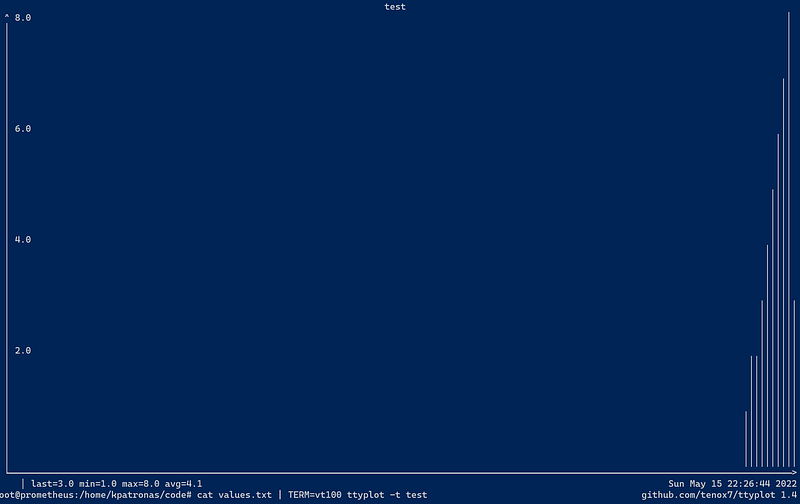
I have a file named values.txt with one column values1
2
2
3
4
5
6
7
8
3
Executing the followcat values.txt | TERM=vt100 ttyplot -t test
Will generate the following plot, the TERM=vt100 is needed in order not to erase screen on ttyplot exit.
Plot values in real-time from another tool
The killer functionality of ttyplot is the ability to ping in real time from tools that run and produce data, like ping.
The following command will extract from the ping results the ping latencyping 8.8.8.8 | sed -u 's/^.*time=//g; s/ ms//g'
PING 8.8.8.8 (8.8.8.8) 56(84) bytes of data.
127
156
53.7
86.8
24.3
223
22.6
To visualize this enterping 8.8.8.8 | sed -u 's/^.*time=//g; s/ ms//g' | ttyplot -t "ping to 8.8.8.8" -u ms
This will generate a real-time graph
ttyplot is a simple but powerful tool with many cool options, but i prefer just to give a simple example good enough to start, if you interest more in this tool i highly recommend to read the excellent documentation on its github page!