Make Your Pandas Operations 3800x Faster!
Doing operations with the iterrows() function

One of the most used ways to perform operations in DataFrames is the iterrows function which is used to iterate over the rows of a DataFrame. It returns a Series for each row, which can be accessed using the index of the row. The performance of the iterrows() function depends on the size of the DataFrame. Generally, it is not considered to be a very performant function, as it can be slow when dealing with large datasets.
Let’s see an example and how it performs; create the following file and save it as iter_test.py.
iter_test.py
#!/usr/bin/env python3
import matplotlib.pyplot as plt
import pandas as pd
import numpy as np
import time

def get_data(size):
    df                  = pd.DataFrame()
    df['age']           = np.random.randint(18,72,size)
    df['gender']        = np.random.choice(['male','female'],size)
    df['salary']        = np.random.randint(680,5000,size)
    return df

def get_sector(row):
    if row['salary'] >= 680 and row['salary'] <= 900:
        row['work_class'] = 'pink collar'
    if row['salary'] >= 901 and row['salary'] <= 1300:
        row['work_class'] = 'blue collar'
    if row['salary'] >= 1301 and row['salary']:
        row['work_class'] = 'white collar'
    return row['work_class']

if __name__ == '__main__':

    kind = []
    size = []
    ts   = []

    print("rows  |  time (sec)")
    print("------|------------")
    for i in range(1000,20000,1000):
        df = get_data(size=i)

        start = time.time()
        for index, row in df.iterrows():
            df.loc[index,'work_class'] = get_sector(row=row)
            end = time.time()
        res=round(end - start,2)
        kind.append("iterration")
        size.append(i)
        ts.append(res)
        print("%s  |  %s"%(i,res))

    measurements = pd.DataFrame(list(zip(kind, size, ts)),columns =['Kind','size','time'])
    measurements.loc[(measurements['Kind']=='iterration')].plot.bar(x='size', y='time')
    plt.show()
This script does the following
- Iterrates from 1000 to 20000 in a iterration step of 1000
- On each loop creates a dataframe with random data, the dataframe on each loop has a size of +1000 rows
- This script uses itterrows to iterrate the dataframe and does some calculations to create for each row the
work_classcolumn. - start and stop are timestamps used to calculate the needed time of each iterration
start = time.time()
for index, row in df.iterrows():
    df.loc[index,'work_class'] = get_sector(row=row)
end = time.time()
res=round(end - start,2)
Iterrows performance Results
From the results and the plot we can identify that using iterrows is slow but at least the duration is linear if the increase of the rows is linear as well
rows  |  time (sec)
------|------------
1000  |  0.63
2000  |  1.35
3000  |  2.32
4000  |  2.53
5000  |  3.09
6000  |  3.7
7000  |  4.24
8000  |  4.57
9000  |  5.36
10000 |  5.82
11000 |  6.31
12000 |  6.9
13000 |  7.74
14000 |  8.35
15000 |  8.6
16000 |  9.15
17000 |  9.9
18000 |  10.14
19000 |  10.7
Doing operations with the apply() function
One also common way to perform operations in Pandas DataFrames is to use the apply() function The Pandas apply() function is used to apply a function to each row or column of a DataFrame. It takes a function as an argument and applies it to each element of the DataFrame. The function can be either a built-in or user-defined.
The performance of the apply() function depends on the complexity of the function being applied. If the function is simple, the performance is good. However, if the function is complex, the performance may be slower.
Lets see an example and how performs, create the following file and save it as apply_test.py.
apply_test.py
#!/usr/bin/env python3
import matplotlib.pyplot as plt
import pandas as pd
import numpy as np
import time

def get_data(size):
    df                  = pd.DataFrame()
    df['age']           = np.random.randint(18,72,size)
    df['gender']        = np.random.choice(['male','female'],size)
    df['salary']        = np.random.randint(680,5000,size)
    return df

def get_sector(row):
    if row['salary'] >= 680 and row['salary'] <= 900:
        row['work_class'] = 'pink collar'
    if row['salary'] >= 901 and row['salary'] <= 1300:
        row['work_class'] = 'blue collar'
    if row['salary'] >= 1301 and row['salary']:
        row['work_class'] = 'white collar'
    return row['work_class']

if __name__ == '__main__':

    kind = []
    size = []
    ts   = []

    print("rows  |  time (sec)")
    print("------|------------")
    for i in range(1000,20000,1000):
        df = get_data(size=i)

        start = time.time()
        df['work_class'] = df.apply(get_sector,axis=1)
        end = time.time()
        res=end - start
        kind.append("apply")
        size.append(i)
        ts.append(res)
        print("%s  |  %s"%(i,res))

    measurements = pd.DataFrame(list(zip(kind, size, ts)),columns =['Kind','size','time'])
    measurements.loc[(measurements['Kind']=='apply')].plot.bar(x='size', y='time')
    plt.show()
This script does the following
- Iterrates from 1000 to 20000 in a iterration step of 1000
- On each loop creates a dataframe with random data, the dataframe on each loop has a size of +1000 rows
- This script uses apply function to apply the function get_sector to the whole DataFrame
- start and stop are timestamps used to calculate the needed time of each iterration
start = time.time()
df['work_class'] = df.apply(get_sector,axis=1)
end = time.time()
res=end - start
Apply Performance Results
From the results and the plot we can identify that using apply is quite faster than itterows and the duration is linear if the increase of the rows is linear as well
rows   |  time (sec)
-------|------------
1000   |  0.41
2000   |  0.82
3000   |  1.19
4000   |  1.6
5000   |  2.02
6000   |  2.46
7000   |  2.76
8000   |  3.14
9000   |  3.69
10000  |  3.97
11000  |  4.36
12000  |  4.94
13000  |  5.11
14000  |  5.59
15000  |  5.95
16000  |  6.43
17000  |  6.83
18000  |  7.36
19000  |  7.74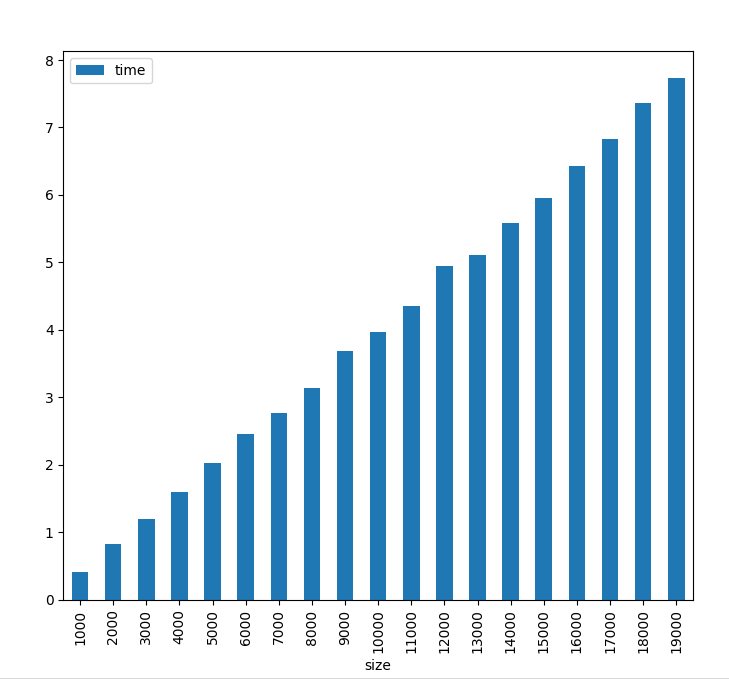
Doing operations using vectorization
Lets talk a bit how Pandas uses vectorization. Pandas vectorization is a process of applying a function to a group of values instead of applying it to each value individually. This process is more efficient than looping through each value and applying the function to it. Vectorization is especially useful when dealing with large datasets, as it can significantly reduce the amount of time and resources needed to process the data. Vectorization is also more performant than looping, as it can take advantage of the underlying hardware architecture to speed up the process.
Lets see an example and how performs, create the following file and save it as vectorization_test.py.
vectorization_test.py
#!/usr/bin/env python3
import matplotlib.pyplot as plt
import pandas as pd
import numpy as np
import time

def get_data(size):
    df                  = pd.DataFrame()
    df['age']           = np.random.randint(18,72,size)
    df['gender']        = np.random.choice(['male','female'],size)
    df['salary']        = np.random.randint(680,5000,size)
    return df

if __name__ == '__main__':

    kind = []
    size = []
    ts   = []

    print("rows  |  time (sec)")
    print("------|------------")
    for i in range(10000,1000000,10000):
        df = get_data(size=i)

        start = time.time()
        df.loc[((df['salary'] >= 680) & (df['salary'] <= 900)),'work_class'] = 'pink collar'
        df.loc[((df['salary'] >= 901) & (df['salary'] <= 1300)),'work_class'] = 'blue collar'
        df.loc[(df['salary'] >= 1301),'work_class'] = 'white collar'
        end = time.time()
        res=round(end - start,10)
        kind.append("vectorization")
        size.append(i)
        ts.append(res)
        print("%s  |  %s"%(i,res))

    measurements = pd.DataFrame(list(zip(kind, size, ts)),columns =['Kind','size','time'])
    measurements.loc[(measurements['Kind']=='vectorization')].plot.bar(x='size', y='time')
    plt.show()
This script does the following
- Iterrates from 10000 to 1000000 in a iterration step of 10000, this is because vectorization is so fast that we need big dataframes to prove that increasing rows linearly also increases execution time linearly, using smaller dataframes can create fake execution times because of random effects.
- On each loop creates a dataframe with random data, the dataframe on each loop has a size of +10000 rows
- This script here does not use any external function to create the rows, but rather uses the
.locfunction which is optimized to use vectorization and create new rows - start and stop are timestamps used to calculate the needed time of each iterration
I will not print the whole results table since its huge but you still can execute the script your self.
rows    |  time (sec)
--------|------------
10000   |  0.0023920536
20000   |  0.0028979778
30000   |  0.0038368702
40000   |  0.0045776367
50000   |  0.0049977303
60000   |  0.0054626465
70000   |  0.0061619282
80000   |  0.009052515
90000   |  0.0073869228
100000  |  0.0078105927
110000  |  0.0087192059
120000  |  0.0101735592
130000  |  0.00994277
140000  |  0.0113101006
150000  |  0.0118412971
160000  |  0.0208461285
        .
        .
        .
900000  |  0.0583508015
910000  |  0.0575618744
920000  |  0.0619075298
930000  |  0.0607154369
940000  |  0.0604178905
950000  |  0.0613391399
960000  |  0.0616879463
970000  |  0.0666260719
980000  |  0.062684536
990000  |  0.0615823269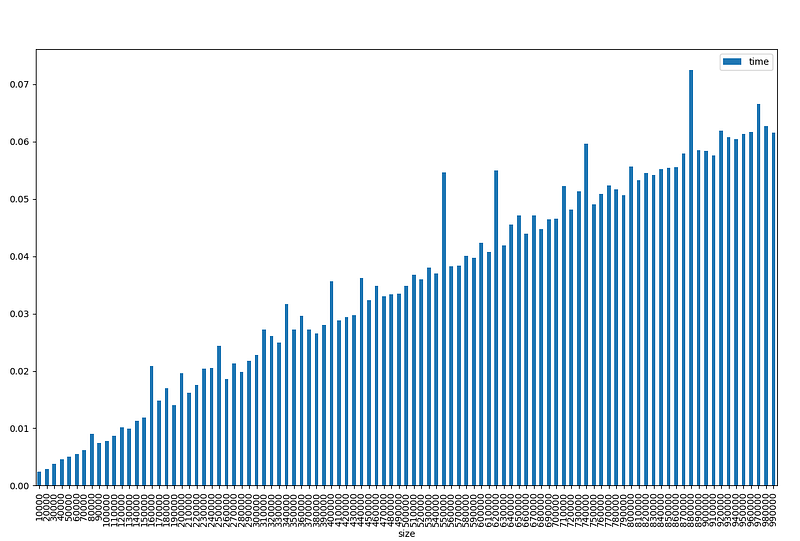
As we can see using vectorization is way faster! even using very large datasets almost one million rows, the execution time is 0.06 second!
Conclusion
To do a meaningful comparison i re-run the vectorization script with the same values as the itteration and apply methods and here are the results
rows   |  time (sec)
-------|------------
1000   |  0.002035141
2000   |  0.0017592907
3000   |  0.0018064976
4000   |  0.0019266605
5000   |  0.0016801357
6000   |  0.0019237995
7000   |  0.0028142929
8000   |  0.0026874542
9000   |  0.0020778179
10000  |  0.0023913383
11000  |  0.0026254654
12000  |  0.0022230148
13000  |  0.0035355091
14000  |  0.0022451878
15000  |  0.0049865246
16000  |  0.0032193661
17000  |  0.0025138855
18000  |  0.0032658577
19000  |  0.0028264523
What this means?
For a DataFrame of 19000 rows the performance was:
- iterration: 10.7 seconds
- apply: 7.74 seconds (27% faster than iterration)
- vectorization: 0.0028 seconds (2764 times faster than apply and 3821 times from iterration)
For small DataFrames i think there is no point to use vectorization, since even being faster the difference will not be human noticeble, but for big DataFrames vectorization is a huge time saver.

In Plain English
Thank you for being a part of our community! Before you go:
- Be sure to clap and follow the writer! 👏
- You can find even more content at PlainEnglish.io 🚀
- Sign up for our free weekly newsletter. 🗞️
- Follow us on Twitter, LinkedIn, YouTube, and Discord.