Python: How to create a plots and subplots
Python is widely used in data science with libraries as pandas and numpy, to plot data can used various libraries but the most commonly…

Python is widely used in data science with libraries as pandas and numpy, to plot data can used various libraries but the most commonly used is matplotlib, in this article we will see how we can create a single plot and multiple plots using subplots, lets start!
Importing needed libraries
Those are all the libraries we will need for the examples, those libraries can be installed with pip if they are not already installed.
import pandas as pd
import numpy as np
import matplotlib.pyplot as plt
Creating random data for plotting
Before with plot our data we need first to create some random data, the data will be stored in the data data frame which consists of four columns named A,B,C,D
np.random.seed(0)
data = pd.DataFrame(np.random.randn(100, 4), columns=['A', 'B', 'C', 'D'])np.random.seed(0)sets the random seed for NumPy’s random number generator. When you set the random seed to a specific value (in this case, 0), it ensures reproducibility of random numbers.np.random.randn(100,4)creates four columns each filled with hundred random numbers.
Creating a single plot
Now we will write the code that creates a single plot, we will create a histogram of two columns from out dataframe (A,B), we will also see how we can modify various attributes of our plot
plt.figure(figsize=(10, 6))
data['A'].plot(kind='hist', alpha=0.5, label='A')
data['B'].plot(kind='hist', alpha=0.5, label='B')
plt.title('Histogram of A and B')
plt.xlabel('Value')
plt.ylabel('Frequency')
plt.legend()
plt.show()plt.figure()creates a new figure object which is like a blank canvas where you can place plots, axes and labels.figsize(10,6)specifies the width and height of the figure in inches.data['A'].plot(kind='hist', alpha=0.5, label='A')Creates the first plot with data from the ‘A’ column of the dataframe,kind='hist'means that the plot will be histogram,alpha=0.5alpha controls the transparency of the the plot, 0.5 means semi-transparent , 1.0 is fully opaque.labelsets a label for the legend of this plot.plt.titleThe title of the plot.xlabelandylabelThe plot axes labels..legend()add a legend to the plot.show()show the plot.
Running the code produces the following plot

Subplots
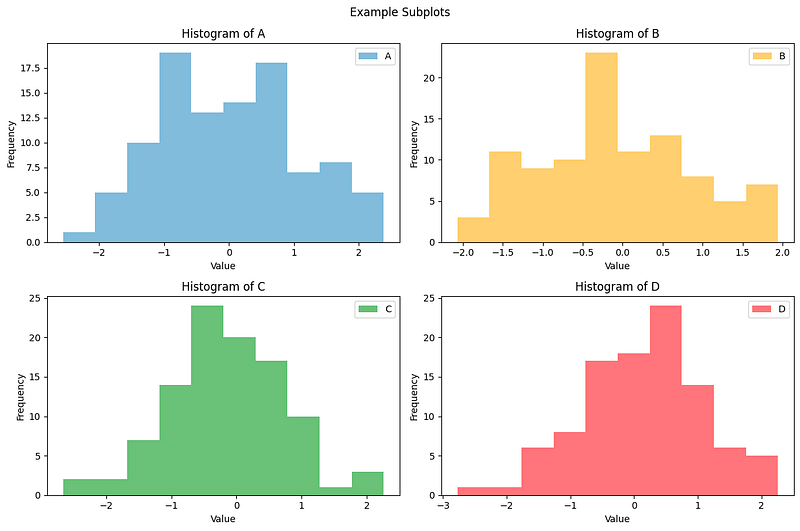
Lets now create a subplots! this subplot will contain four subplots, one histogram of each column for the data dataframe.
fig, axes = plt.subplots(nrows=2, ncols=2, figsize=(12, 8))

data['A'].plot(ax=axes[0, 0], kind='hist', alpha=0.5, label='A')
axes[0, 0].set_title('Histogram of A')
axes[0, 0].set_xlabel('Value')
axes[0, 0].set_ylabel('Frequency')
axes[0, 0].legend()

data['B'].plot(ax=axes[0, 1], kind='hist', alpha=0.5, color='orange', label='B')
axes[0, 1].set_title('Histogram of B')
axes[0, 1].set_xlabel('Value')
axes[0, 1].set_ylabel('Frequency')
axes[0, 1].legend()

data['C'].plot(ax=axes[1, 0], kind='hist', alpha=0.5, color='green', label='C')
axes[1, 0].set_title('Histogram of C')
axes[1, 0].set_xlabel('Value')
axes[1, 0].set_ylabel('Frequency')
axes[1, 0].legend()

data['D'].plot(ax=axes[1, 1], kind='hist', alpha=0.5, color='red', label='D')
axes[1, 1].set_title('Histogram of D')
axes[1, 1].set_xlabel('Value')
axes[1, 1].set_ylabel('Frequency')
axes[1, 1].legend()

fig.suptitle('Example Subplots')

plt.tight_layout()
plt.show()
Dont be scared! the code might look complex and intimidating but really it is not!, lets explain everything
fig, axes = plt.subplots(nrows=2, ncols=2, figsize=(12, 8))plt.subplots creates subplots, in this case will create a subplot with graphs as defined by thenrowsandncolsvariables, the size will be 12x8 inches and will return two objects, thefigand theaxesobjects.data['A'].plot(ax=axes[0,0] .... color='orange')creates the grapg in the upper left position of the subplotax=axes[0,0]withcolour='orange'.axes[]object holds the properties of each graph of the subplot, properties likeset_title,set_xlabel & set_ylabeland thelegend()fig.suptitlesets the title of the subplotplt.tight_layout()is used to automatically adjust the layout of the subplots to prevent overlapping or excessive whitespace between them. It optimizes the spacing between subplots and ensures that all elements within the figure are properly displayed.
Running the code produces the following subplot
Conclusion
Creating plots and subplots in Python might be a difficult for beginners, i hope these examples are very crystal clear to understand and make you more confided writing code! i hope you enjoyed this article!
In Plain English 🚀
Thank you for being a part of the In Plain English community! Before you go:
- Be sure to clap and follow the writer ️👏️️
- Follow us: X | LinkedIn | YouTube | Discord | Newsletter
- Visit our other platforms: CoFeed | Differ
- More content at PlainEnglish.io